Realtime monitoring
Kanaloa can be configured to report metrics of the service to graphite through statsD. This enables users to monitor a set of critical metrics (throughput, failure rate, queue length, expected wait time, service process time, the number of concurrent requests, etc.) in real time. It also provides real-time insights into how the kanaloa proxy is working. Here is a screenshot of the realtime monitoring using Grafana UI.
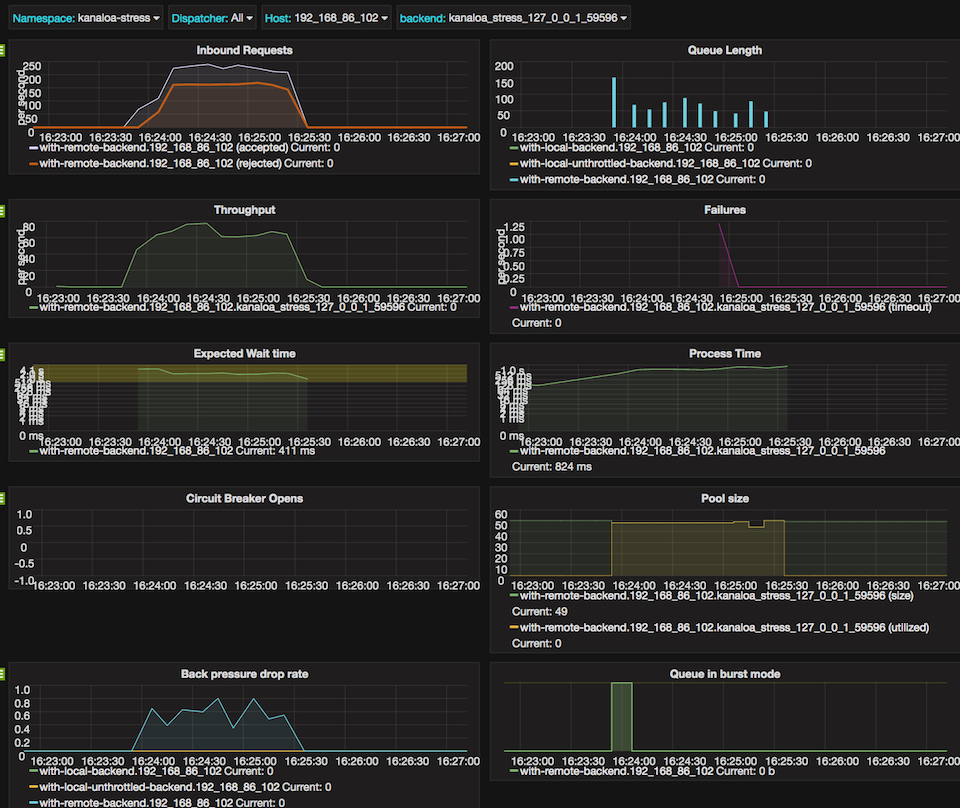
Kanaloa has a built-in statsD reporter that allows users to monitor important metrics in real time.
To enable it, add the following to your config
kanaloa {
  statsD {
    host = "localhost"
    port = 8125
  }
  default-dispatcher {
    metrics {
      enabled = on
      statsD {
        namespace = "kanaloa"
      }
    }
  }
}
Metrics reporting settings at the dispatcher level, e.g.
kanaloa {
  dispatchers {
    example1 {
      metrics.enabled = off
    }
    example2 {
      metrics {
        statsD {
          event-sample-rate = 0.01
        }
      }
    }
  }
}
Visualize with Grafana
We provide a grafana dashboard if you are using grafana for statsD visualization. We also provide a docker image with which you can quickly get up and running a statsD server and visualization web app. Please follow the instructions there.